

Last updated on May 19th, 2026 at 03:46 pm
Email marketing delivers $36 to $45 for every $1 spent. That number means nothing if you track the wrong metrics.
Most marketers check open rates, feel good or bad, and move on. Meanwhile the numbers that predict revenue, retention, and list health sit untouched in their ESP dashboard.
This guide covers the 10 essential email marketing metrics for 2026, the benchmarks that separate average from excellent, the formulas behind each one, and the specific actions that move them. Whether you send 500 emails a month or 500,000, the measurement framework is the same.
Why Email Marketing Metrics Matter
You can’t improve what you don’t measure.
Email marketing is one of the highest-ROI channels available — but only if you know which numbers to watch, what they mean, and how to move them in the right direction.
Too many marketers obsess over vanity metrics (like list size) while ignoring the signals that actually predict revenue. Others track everything but analyze nothing, drowning in data without actionable insights.
This guide cuts through the noise. We’ll cover:
- The essential metrics every email marketer must track in 2026
- Industry benchmarks so you know where you stand
- Formulas and calculations to measure accurately
- Actionable strategies to improve each metric
- How to build a tracking system using the Email Marketing Toolkit in Notion
Whether you’re sending your first campaign or optimizing your 500th, this is your definitive reference for email marketing metrics.
The 10 Essential Email Marketing Metrics
1. Open Rate
What it measures: The percentage of recipients who opened your email.
Formula: (Emails Opened ÷ Emails Delivered) × 100
2026 Benchmarks:
- Average across all industries: 37–42% (Klaviyo, MailerLite)
- ActiveCampaign average: 39.26%
- Global benchmark: 55.4% (Dotdigital — includes Apple MPP inflation)
- Top performers: 50%+
Important note: Apple’s Mail Privacy Protection (MPP) artificially inflates open rates by pre-loading email content. Real open rates are lower than reported numbers. Use open rate as a directional trend indicator, not an absolute truth.
How to improve your open rate:
- Write compelling subject lines (see our guide: How to Write Email Subject Lines That Get Opened)
- Personalize subject lines with subscriber names or interests
- Test send times — try Tuesday 10am, Thursday 2pm, and Saturday 9am
- Keep your sender name consistent and recognizable
- Clean your list regularly to remove inactive subscribers
- Optimize preview text to complement your subject line
2. Click-Through Rate (CTR)
What it measures: The percentage of recipients who clicked a link in your email.
Formula: (Total Clicks ÷ Emails Delivered) × 100
2026 Benchmarks:
- Average across all industries: 1.69–2.3% (Klaviyo, Campaign Monitor)
- Global benchmark: 3.7% (Dotdigital)
- Top 10% of performers: 3.38%+
- Good target range: 2–5%
How to improve your CTR:
- Use a single, clear call-to-action (CTA) per email
- Make CTA buttons large, colorful, and above the fold
- Use action-oriented language: “Get the template” beats “Click here”
- Add multiple link placements — text link, button, and image
- Keep email copy focused on one topic
- Create urgency with deadlines or limited availability
- Segment your list to send more relevant content
3. Click-to-Open Rate (CTOR)
What it measures: The percentage of openers who clicked — a purer measure of content engagement.
Formula: (Unique Clicks ÷ Unique Opens) × 100
2026 Benchmarks:
- Average: 10.5% (Campaign Monitor)
- Good target: 12–15%
- Top performers: 20%+
Why CTOR matters: Open rate tells you if your subject line worked. CTR tells you the overall campaign performance. But CTOR isolates content quality — it answers: “Among people who opened, how compelling was the email itself?”
How to improve your CTOR:
- Lead with the most valuable content at the top
- Use engaging visuals — images, GIFs, or embedded video thumbnails
- Write concise paragraphs (2–3 sentences max)
- Create a visual hierarchy with headers, bullets, and whitespace
- Match your CTA to the promise in your subject line
4. Conversion Rate
What it measures: The percentage of recipients who completed a desired action (purchase, sign-up, download).
Formula: (Conversions ÷ Emails Delivered) × 100
2026 Benchmarks:
- Average: 2–5% for well-optimized campaigns
- E-commerce: 3–5% for promotional emails
- B2B: 1–3% for lead generation campaigns
- Welcome sequences: 5–10% (highest-converting email type)
How to improve your conversion rate:
- Align email content with landing page — maintain message consistency
- Reduce friction in the conversion process (fewer form fields, one-click purchases)
- Use social proof — testimonials, reviews, user counts
- Create urgency with genuine deadlines
- Segment and personalize — relevant offers convert 3–5x better
- Optimize for mobile — 60%+ of emails are opened on phones
5. Bounce Rate
What it measures: The percentage of emails that failed to deliver.
Formula: (Bounced Emails ÷ Emails Sent) × 100
Types of bounces:
- Hard bounce — Invalid email address (permanent failure). Remove immediately.
- Soft bounce — Temporary issue (full inbox, server down). Retry 2–3 times, then remove.
2026 Benchmarks:
- Healthy bounce rate: Under 2%
- Acceptable: 2–5%
- Problematic: Over 5% (clean your list immediately)
How to reduce bounce rate:
- Use double opt-in to verify email addresses at signup
- Clean your list every 90 days
- Remove hard bounces immediately after each campaign
- Avoid purchasing email lists (high bounce rates guaranteed)
- Use an email verification tool before importing lists
6. Unsubscribe Rate
What it measures: The percentage of recipients who opted out of your list.
Formula: (Unsubscribes ÷ Emails Delivered) × 100
2026 Benchmarks:
- Global average: 0.1–0.14% (Campaign Monitor, Dotdigital)
- Acceptable: Under 0.5%
- Warning sign: Over 0.5% per campaign
How to reduce unsubscribe rate:
- Set clear expectations at signup (content type, frequency)
- Segment your list — send relevant content to each group
- Offer a preference center — let subscribers choose topics and frequency
- Follow the 80/20 rule: 80% value, 20% promotional
- Don’t send too frequently — respect inbox space
- If someone unsubscribes, analyze which email triggered it
7. List Growth Rate
What it measures: How fast your list is growing (accounting for unsubscribes and bounces).
Formula: ((New Subscribers – Unsubscribes – Bounces) ÷ Total List Size) × 100
2026 Benchmarks:
- Healthy monthly growth: 2–5%
- Excellent: 5–10%
- If negative: You’re losing subscribers faster than gaining them — urgent action needed
How to improve list growth rate:
- Create high-value lead magnets for every audience segment
- Optimize signup form placement (homepage, blog, exit intent)
- Run co-marketing campaigns with complementary brands
- Promote your newsletter on social media consistently
- Add signup CTAs to your email signature
- Host webinars, workshops, or challenges that require email registration
8. Revenue Per Email (RPE)
What it measures: The average revenue generated per email sent.
Formula: Total Revenue from Campaign ÷ Emails Delivered
Why it matters: RPE is the ultimate bottom-line metric. It connects your email marketing directly to business revenue — which is what stakeholders and business owners actually care about.
2026 Context:
- Email marketing delivers $36–$45 ROI for every $1 spent
- Average order value from email: 17% higher than social media referrals
- Automated emails generate 320% more revenue per email than non-automated campaigns
How to improve RPE:
- Segment promotional emails by purchase history and interest
- Use dynamic product recommendations
- Optimize your email-to-landing-page experience
- Test different offer types (discount vs. free shipping vs. bundle)
- Set up automated revenue-generating sequences (welcome, abandoned cart, post-purchase)
9. Email Deliverability Rate
What it measures: The percentage of emails that actually reach subscribers’ inboxes.
Formula: (Emails Delivered ÷ Emails Sent) × 100
2026 Benchmarks:
- Target: 95%+ deliverability
- Good: 90–95%
- Problematic: Under 90%
Factors that affect deliverability:
- Sender reputation — Based on bounce rates, spam complaints, and engagement
- Authentication — SPF, DKIM, and DMARC must be properly configured
- Content quality — Avoid spam trigger words and excessive images
- List hygiene — Clean lists = better deliverability
- Engagement rates — Mailbox providers use engagement signals to filter emails
How to improve deliverability:
- Authenticate your domain (SPF, DKIM, DMARC)
- Monitor your sender score with tools like Google Postmaster
- Warm up new sending domains gradually
- Remove inactive subscribers who haven’t engaged in 90+ days
- Avoid spam trigger words in subject lines
- Make unsubscribing easy — it’s better than spam complaints
10. Spam Complaint Rate
What it measures: The percentage of recipients who marked your email as spam.
Formula: (Spam Complaints ÷ Emails Delivered) × 100
2026 Benchmarks:
- Target: Under 0.1% (Google’s threshold)
- Acceptable: Under 0.08%
- Dangerous: Over 0.1% (risk of being blacklisted)
How to minimize spam complaints:
- Only email people who explicitly opted in
- Include a clear, easy-to-find unsubscribe link
- Honor unsubscribe requests immediately
- Don’t use deceptive subject lines
- Keep your sending frequency consistent
- Include your physical mailing address (required by CAN-SPAM)
2026 Benchmark Summary Table
Here’s your quick-reference for all key metrics:
- Open Rate: Average 37–42% → Good 45%+ → Excellent 50%+
- Click-Through Rate: Average 1.7–2.3% → Good 3%+ → Excellent 5%+
- Click-to-Open Rate: Average 10.5% → Good 15%+ → Excellent 20%+
- Conversion Rate: Average 2–5% → Good 5%+ → Excellent 10%+
- Bounce Rate: Target under 2% → Warning 2–5% → Critical 5%+
- Unsubscribe Rate: Average 0.1–0.14% → Warning 0.3%+ → Critical 0.5%+
- List Growth Rate: Healthy 2–5%/month → Excellent 5–10%/month
- Deliverability: Target 95%+ → Good 90–95% → Problematic under 90%
- Spam Complaint Rate: Target under 0.08% → Danger zone 0.1%+
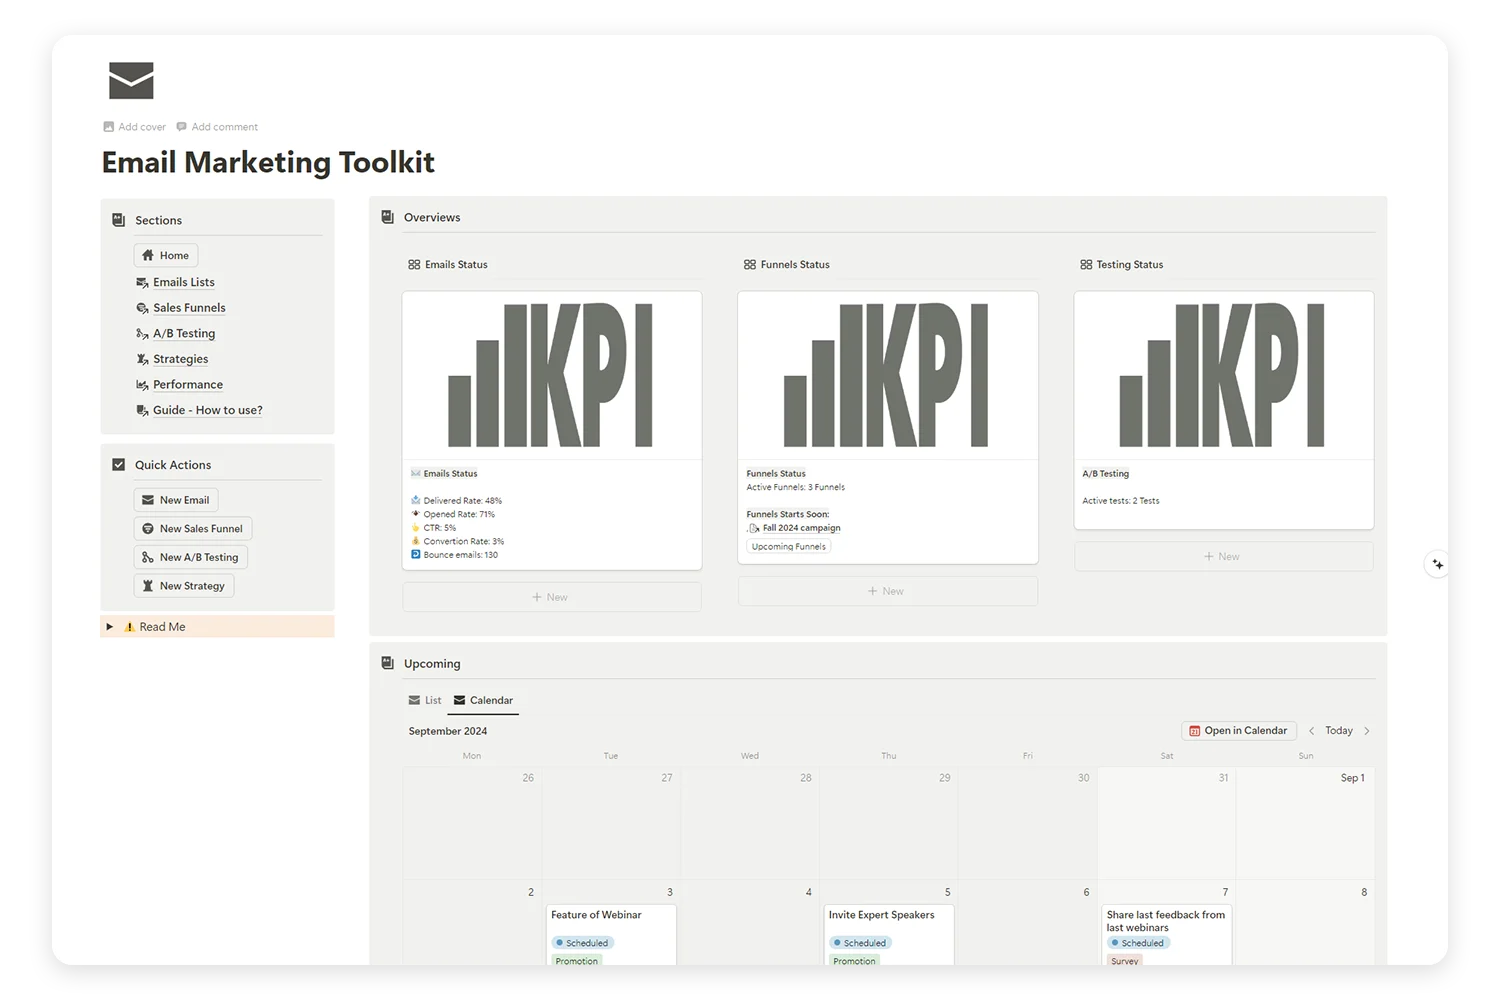
Supercharge Your Email Marketing with the Ultimate Toolkit!
Tired of juggling multiple platforms to manage your email campaigns, sales funnels, and A/B tests? Our Email Marketing Toolkit is here to organize, analyze, and optimize your email strategies—all in one place.
3 New Metrics for 2026: Beyond Traditional KPIs
The email landscape is evolving, and so should your measurement approach. Here are three emerging metrics that forward-thinking marketers are now tracking:
1. Subscriber Lifetime Value (SLV)
Goes beyond single-campaign metrics to measure how much revenue a subscriber generates over their entire relationship with your brand.
Why it matters: A subscriber who opens every email and buys once a quarter is far more valuable than one who opens once and unsubscribes. SLV helps you justify acquisition costs and prioritize retention.
2. Engagement Depth Score
Combines multiple signals — opens, clicks, replies, forwards, and time spent reading — into a single engagement score per subscriber.
Why it matters: In 2026, mailbox providers use engagement signals to determine inbox placement. A composite score helps you identify your most (and least) engaged subscribers for better segmentation.
3. Reply Rate
The percentage of recipients who actually reply to your emails.
Why it matters: Replies are the strongest positive signal you can send to mailbox providers. They also indicate genuine human connection with your audience. Encouraging replies (even simple ones) improves deliverability and builds relationships.
How to Build a Metrics Tracking System in Notion
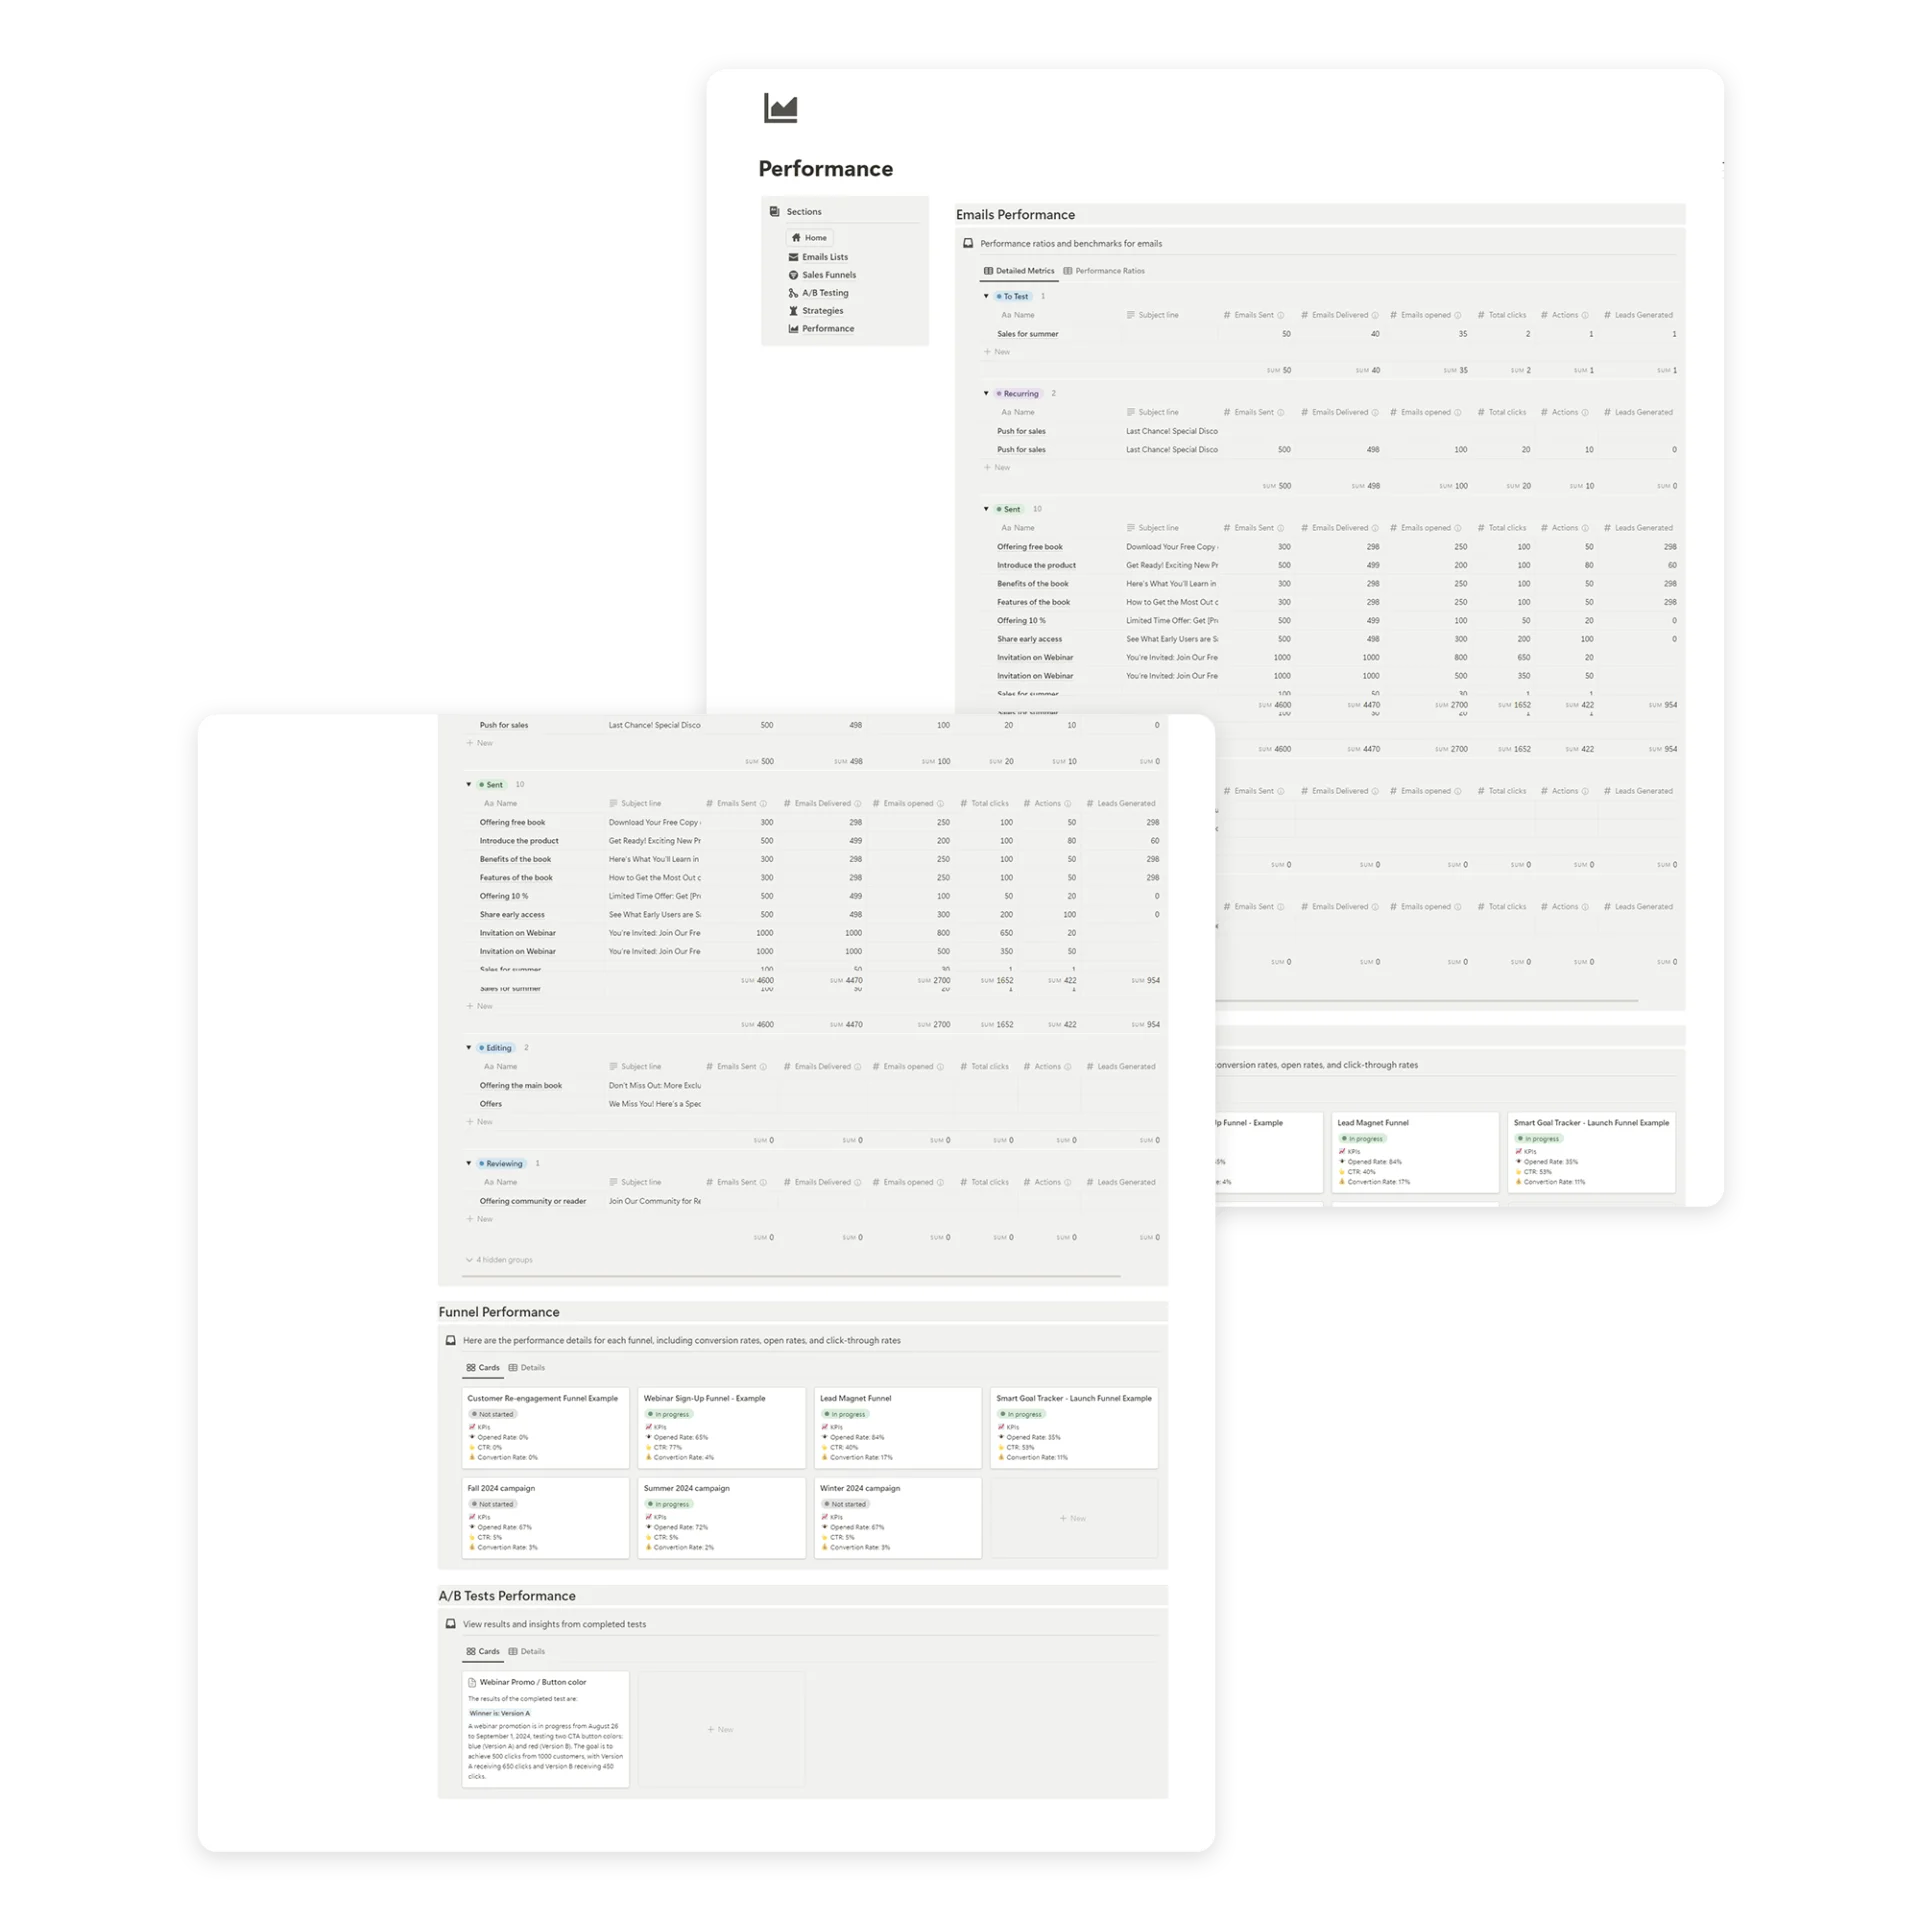
Data is only useful if it’s organized and reviewed consistently. The Email Marketing Toolkit for Notion gives you a built-in system to track all your email marketing metrics in one place.
What You Can Track in the Toolkit
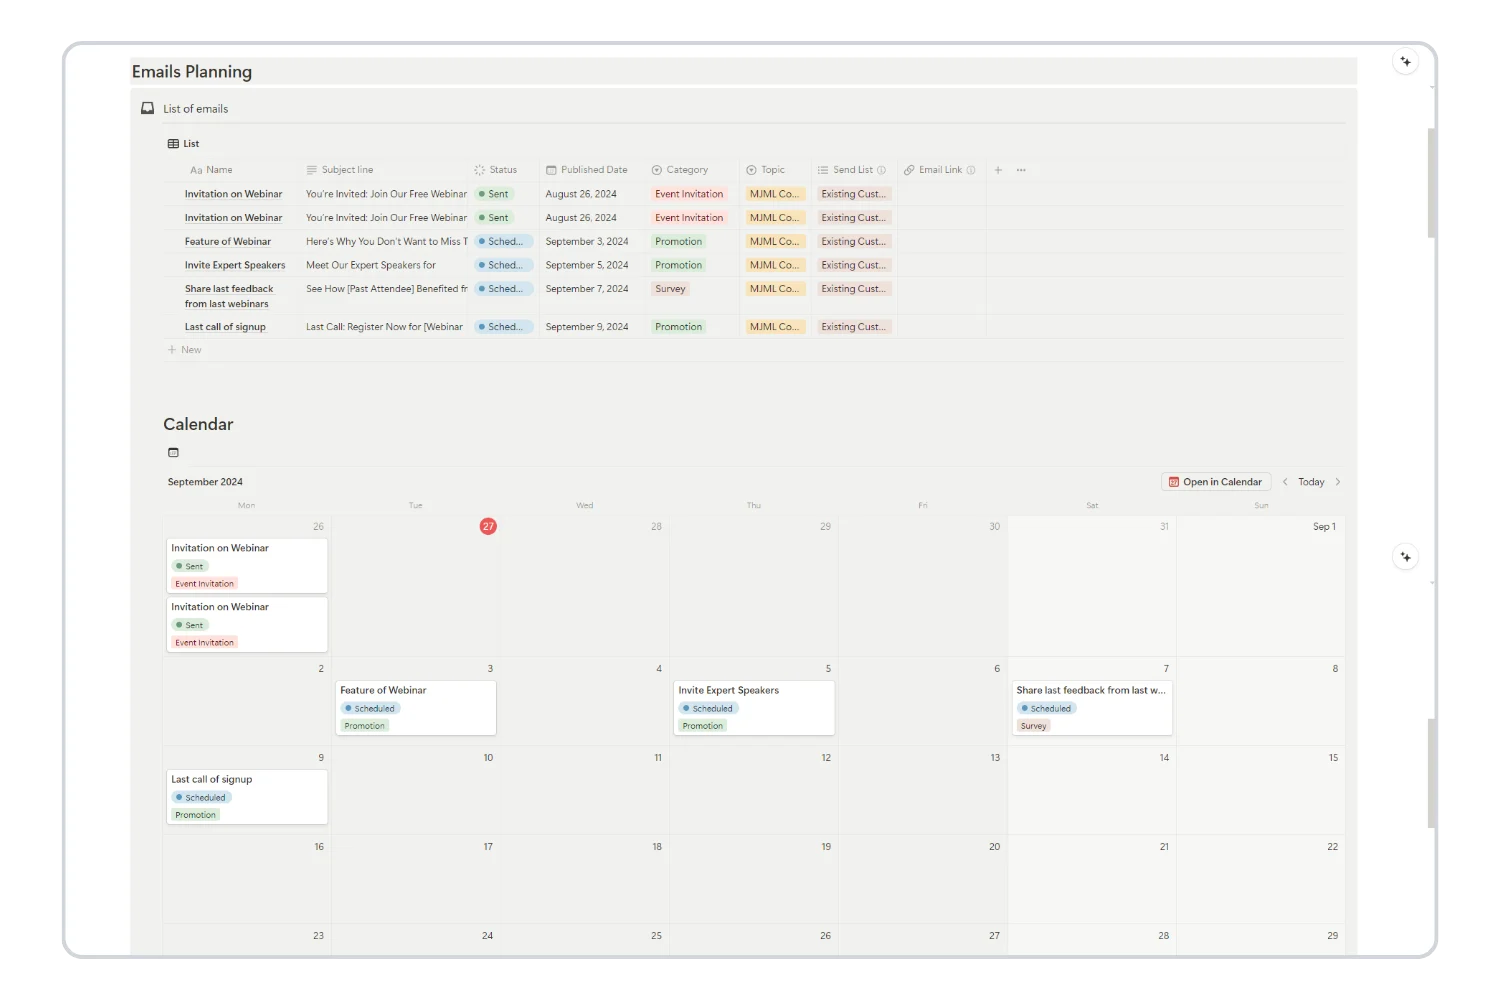
- Campaign-level metrics — Open rate, CTR, CTOR, conversions for each email
- Monthly trends — See how your metrics change over time
- Segment performance — Compare metrics across audience segments
- A/B test results — Document what you tested and what won
- Revenue attribution — Connect email campaigns to revenue
Setting Up Your Monthly Review Process
- Export your ESP data after each campaign (or at month-end)
- Log key metrics in your Toolkit’s performance tracker
- Compare against benchmarks — Use the reference table above
- Identify winners and losers — Which campaigns outperformed? Which underperformed?
- Document learnings — What subject lines, content types, or send times worked best?
- Set next month’s targets — Pick 1–2 metrics to actively improve
Weekly vs. Monthly Tracking Cadence
Track weekly:
- Open rate and CTR for each campaign sent
- A/B test results
- Any deliverability issues or unusual bounce spikes
Track monthly:
- List growth rate
- Unsubscribe trends
- Revenue per email
- Segment performance comparison
- Overall engagement trends
Track quarterly:
- Subscriber lifetime value
- Deliverability health check
- List cleaning and re-engagement campaigns
- Strategy adjustments based on 3-month trends
Common Metrics Mistakes to Avoid
1. Obsessing Over Open Rate Alone
Open rate is important, but it’s the beginning of the story, not the end. An email with a 60% open rate and 0.5% CTR is underperforming compared to one with a 35% open rate and 4% CTR.
2. Comparing Yourself to Global Averages
Benchmarks are useful starting points, but your best comparison is your own past performance. An improvement from 25% to 32% open rate is more meaningful than worrying about the industry average of 42%.
3. Ignoring Deliverability Until It’s a Problem
By the time you notice deliverability issues (emails going to spam), the damage is already done. Monitor your sender reputation proactively and clean your list regularly.
4. Not Tracking Revenue
If you can’t connect your email marketing to revenue, you can’t justify the investment. Set up UTM parameters and conversion tracking from day one.
5. Measuring Without Acting
Data without action is just noise. Every metric you track should connect to a specific improvement strategy. If you’re not going to act on a metric, stop tracking it.
Your Action Plan: Start Tracking What Matters
Here’s how to implement a metrics-driven email marketing approach:
- Set up tracking for the 5 core metrics — Open rate, CTR, conversion rate, unsubscribe rate, and list growth rate
- Establish your baselines — Run 4–6 campaigns and calculate your averages
- Compare against benchmarks — Use the 2026 benchmarks in this guide
- Pick 1–2 metrics to improve — Focus your testing and optimization efforts
- Build a monthly review habit — Schedule 30 minutes each month for analysis
- Use a centralized tracking system — Keep everything in one Notion workspace
Frequently Asked Questions About Email Marketing Metrics
What is the most important email marketing metric to track?
Conversion rate. Opens and clicks tell you people engaged, but conversions tell you they acted. If you track only one metric, track the one tied to revenue or your primary goal.
How often should I check my email marketing metrics?
Review campaign-level metrics (open rate, CTR) after every send. Run a full analysis monthly: list growth, unsubscribe trends, revenue per email, and segment performance. Do a deep health check quarterly for deliverability, list hygiene, and strategy adjustments.
Are open rates still reliable in 2026?
Less reliable than before. Apple Mail Privacy Protection pre-loads email content, inflating open rates by 10-30%. Use open rate as a directional trend over time, not an absolute number. Pair it with CTR and CTOR for a more accurate engagement picture.
What is a good click-through rate for email marketing?
The 2026 average sits between 1.7% and 2.3%. A good CTR is 3%+. Top performers hit 5%+. Your best benchmark is your own past performance. If you improve from 1.5% to 2.8%, that matters more than chasing a global average.
How do I calculate revenue per email?
Divide total revenue attributed to a campaign by the number of emails delivered. Example: a campaign generates $1,200 from 4,000 delivered emails. RPE = $0.30. Track this per campaign and monthly to see which email types drive the most revenue.
What is the difference between CTR and CTOR?
CTR (click-through rate) measures clicks against all delivered emails. CTOR (click-to-open rate) measures clicks against only those who opened. CTR shows overall campaign performance. CTOR isolates content quality. Use both together for a complete picture.
How do I reduce my email bounce rate?
Use double opt-in at signup. Clean your list every 90 days. Remove hard bounces immediately after each send. Never buy email lists. Use an email verification tool before importing any new contacts.
What bounce rate is too high?
Anything over 2% needs attention. Over 5% is critical and risks your sender reputation. If you hit 5%+, stop sending and clean your list before the next campaign.
How can I track email marketing metrics in Notion?
Use the Email Marketing Toolkit for Notion. It includes a campaign tracker with columns for open rate, CTR, CTOR, conversions, and revenue. Log metrics after each send, run monthly reviews, and track trends over time in one connected workspace.
What metrics should beginners focus on first?
Start with five: open rate, click-through rate, conversion rate, unsubscribe rate, and list growth rate. These five give you a complete picture of email health. Add revenue per email and deliverability rate once you have a consistent sending rhythm.
Need a ready-made system to track all your email marketing metrics? The Email Marketing Toolkit for Notion includes a full performance dashboard, campaign tracker, and A/B testing log.
👉 Get the Email Marketing Toolkit
Want to start with the basics? The Email Marketing Mini Planner includes simple campaign tracking to help you build the habit.